ScanPaperLine is a step-by-step process to convert any kinds of scanned images (e.g. seismic reflection or GPR data) into SEG-Y format. The workflows proposed by the module allow both digitalization and vectorization of data.
Colors Digitalization
With the Colors Digitalization process, signal amplitudes are color-coded so that a color could be directly linked to one single scalar value. Hence Digitalization could be assimilated to a color scale recognition.
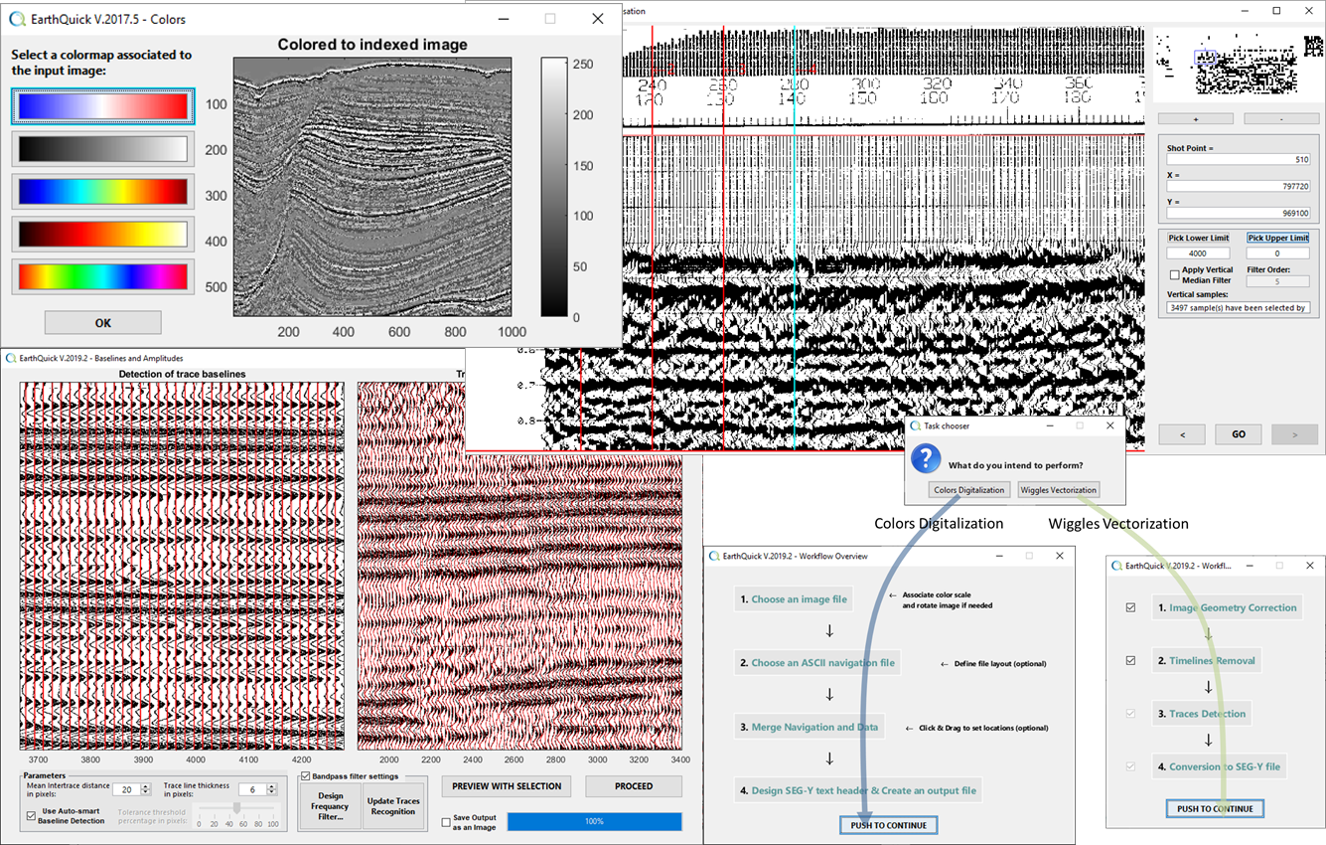
Steps to be fulfilled are such as:
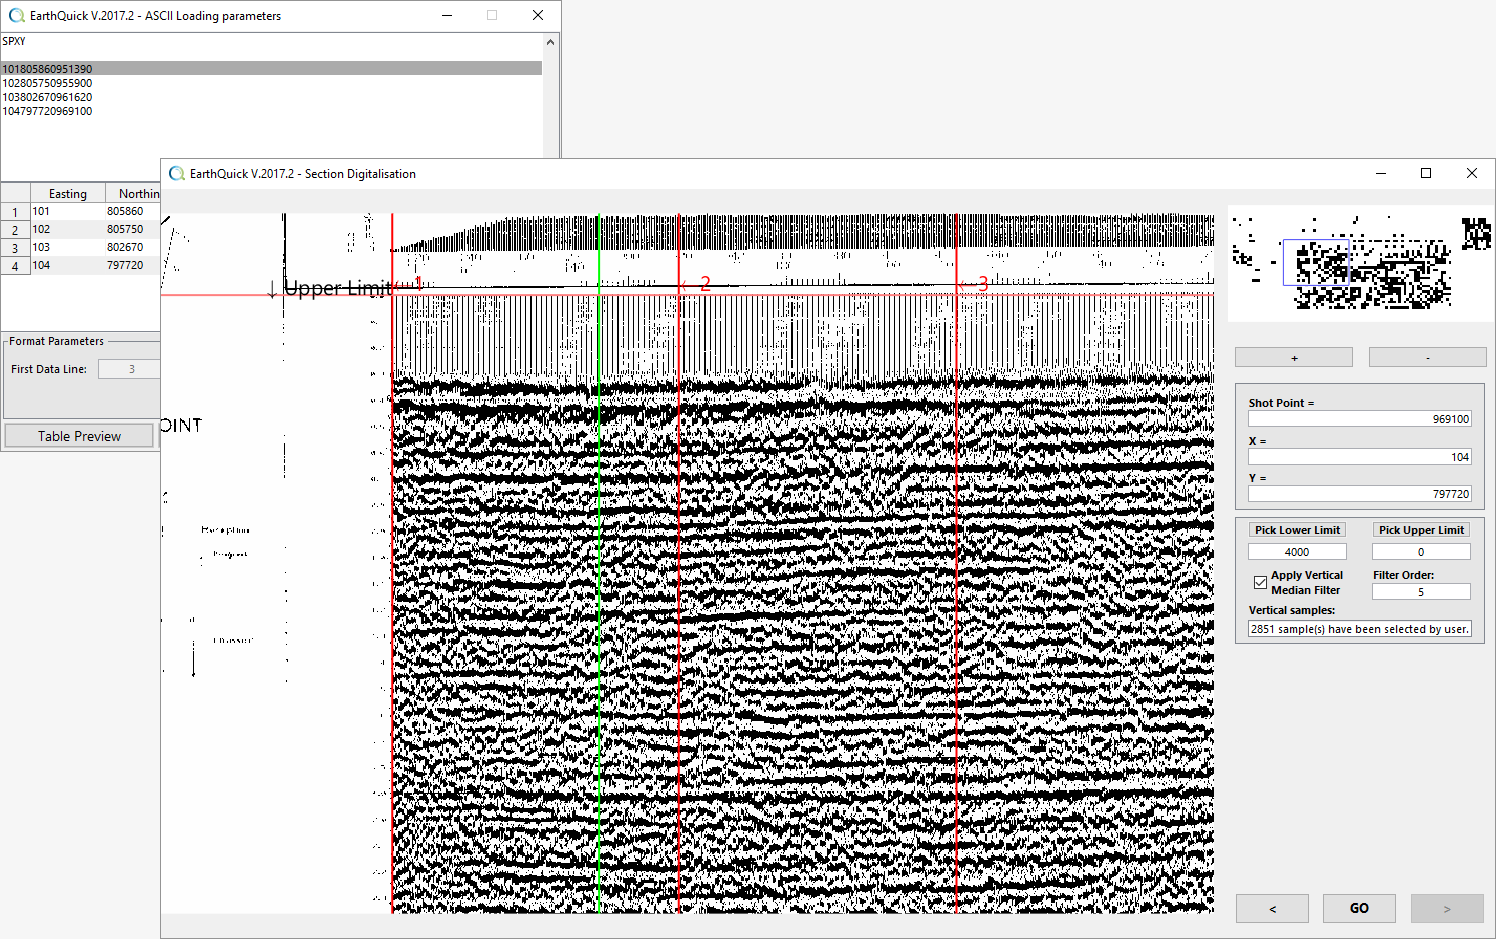
- An image representing a vertical section of the subsurface must be chosen (with rotation possibilities) and its color scale must be carefully handled,
- Navigation, if any, is loaded with a flexible ASCII loader,
- Links between image and navigation, if any, are set through a friendly user interface,
- SEG-Y export ends the workflow.
Wiggles Vectorization
When a section of data shows signal amplitudes as wiggles, which looks like multiple side-by-side seismograph curves, with the Wiggles Vectorization process instead, the curves could be retraced with pattern/curve recognition algorithms.
That functionality relies on algorithms deeply inspired from a publication by Daniel Sopher from the Geological Survey of Sweden: Sopher, D. (2018) Converting scanned images of seismic reflection data into SEG‐Y format. Earth Science Informatics,11, 241. Available at: https://doi.org/10.1007/s12145-017-0329-z.
Steps to be fulfilled are such as:
- After loading the input image (including rotation possibilities), warping, adapted to the current data kind, is proposed. That step remains optional,
- Removal of timelines is the following optional steps if images are marred by timelines, often occurring every 100ms on seismic sections. That remains also optional,
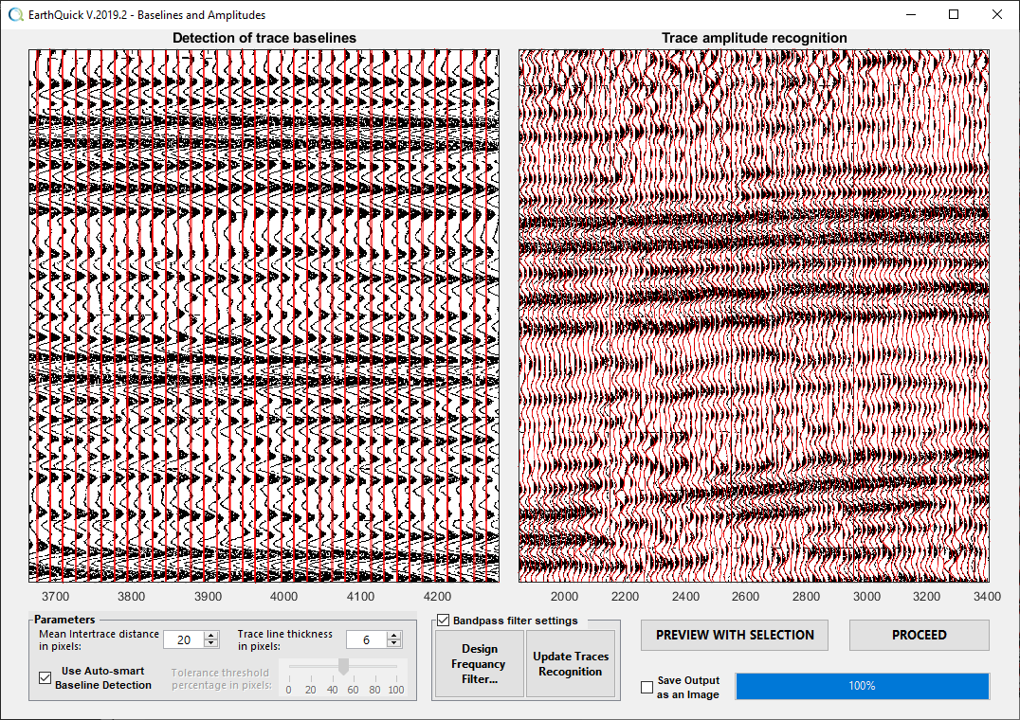
- Detection of trace baselines is a mandatory step. That corresponds to central value of oscillating signal of each signal trace,
- Trace amplitude recognition follows with frequency filtering possibilities,
- SEG-Y export ends the workflow.
Download user guide for a sharp insight.


