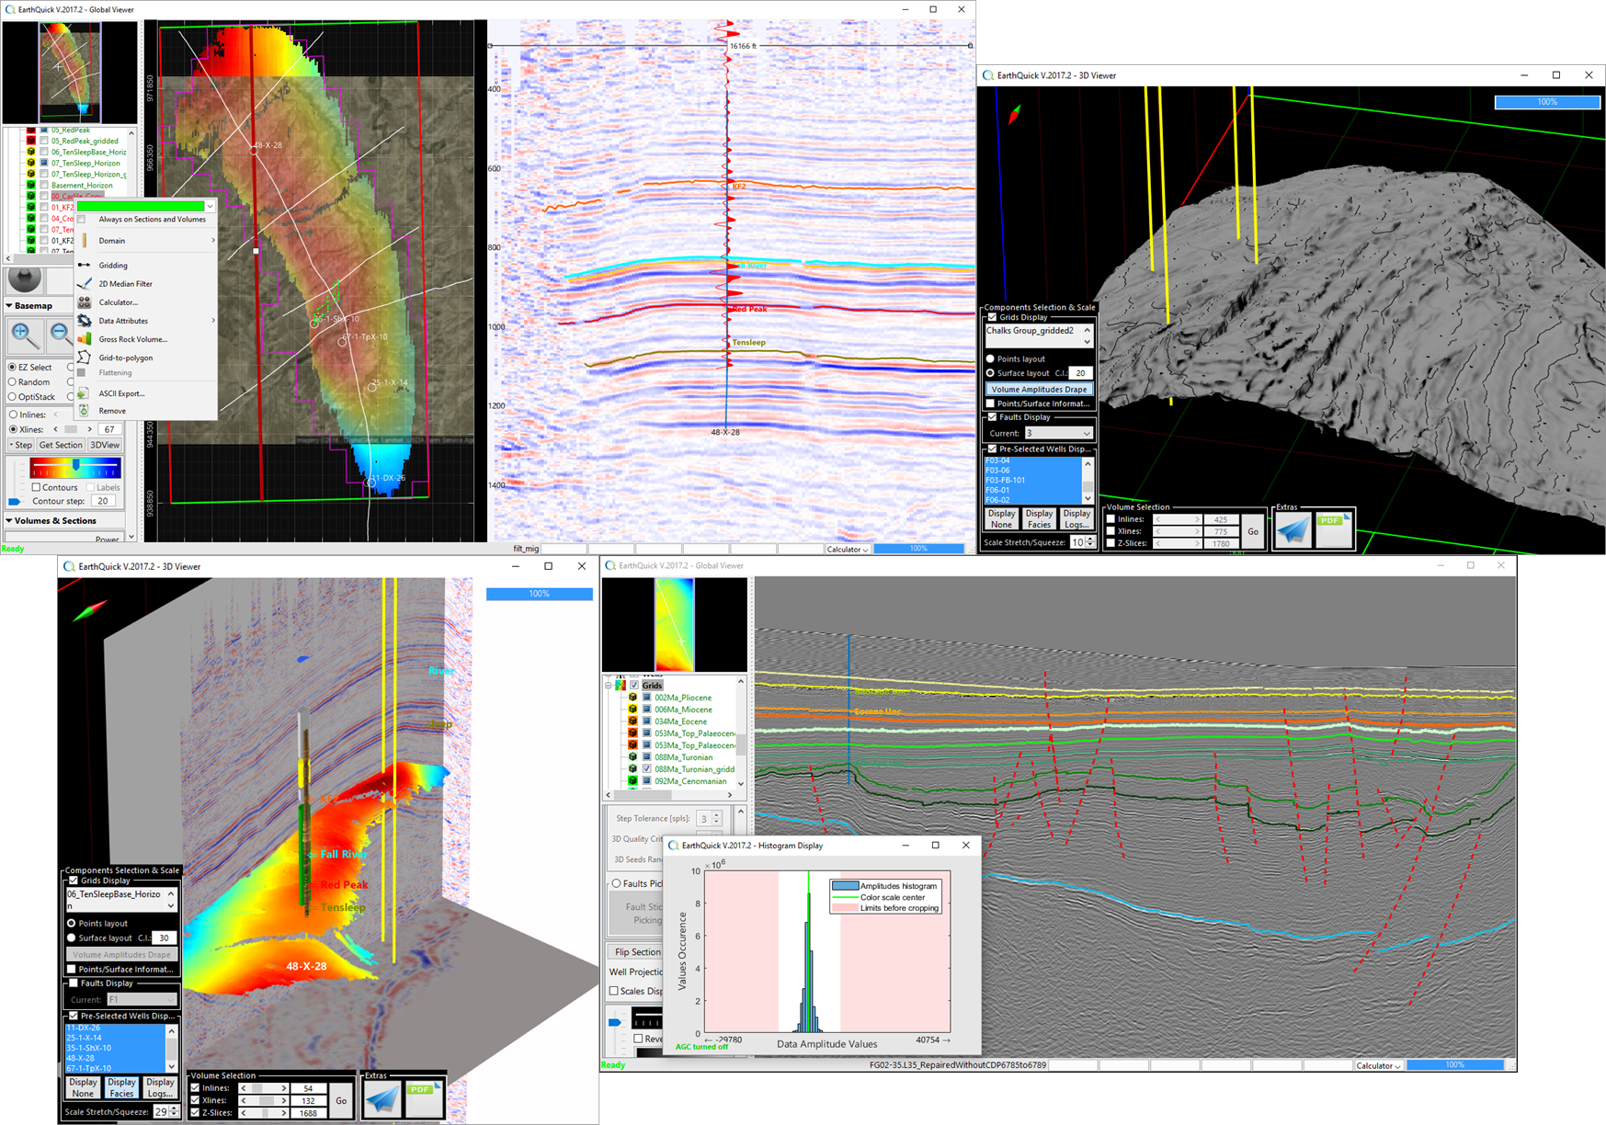
The Global Viewer stands as the core of EarthQuick, gathering all data/items in one module:
- 2D-3D seismic data (from SEG-Y files),
- Wells (logs, TD, KB, checkshot, deviation, stratigraphic markers and lithostratigraphic facies),
- Interpretation Grids and Faults,
- Images overlapping maps,
- Geopolygons/lines,
- Metadata.
Among a wide scope of functionalities, some could be quoted:
- EZ Selection is made by clicking on base map objects,
- Friendly color scales could be handled,
- 2D and 3D automatic or manual picking,
- Faults picking and automatic faults boundaries,
- Handsfree picking on Section Panel without shape restrictions,
- Wells logs overlapping on seismic sections,
- Seismic attributes computation and optimized display,
- Different sections from both 2D and 3D dataset could be merged simply by 2 mouse clicks,
- Random lines could be generated through seismic cubes. All random lines could be dragged and dropped within seismic cube after being generated,
- Optical stack within 3D seismic data,
- 3D rendering with 3D seismic data, wells, grids (including amplitude extraction drapping facility),
- Frequency power spectrum and F-k power spectrum,
- Misties assessment,
- Images georeferencing,
- ...
Handy tools:
- Interactive ruler/scale bar to rapidly assess distance on basemap and seismic panel,
- Polygons to be drawn to assess area computation,
- Grids Calculator to perform all arithmetic and logical operations, up to layer-cake Time-to-Depth conversion for instance...,
- Seismic AVI-Movie generator from SEG-Y to have a quick glance through 3D seismic,
- Feed PowerPointTM presentations with screenshots pushing one single button,
- Export 3D rendering to 3D PDF Files,
- GRV assessments from Top depth grid, target thickness and GWC/OWC,
- ...
Numerous possibilities of I/O exist to maximize compliance and ease redundant tasks.
Download user guide for a sharp insight.
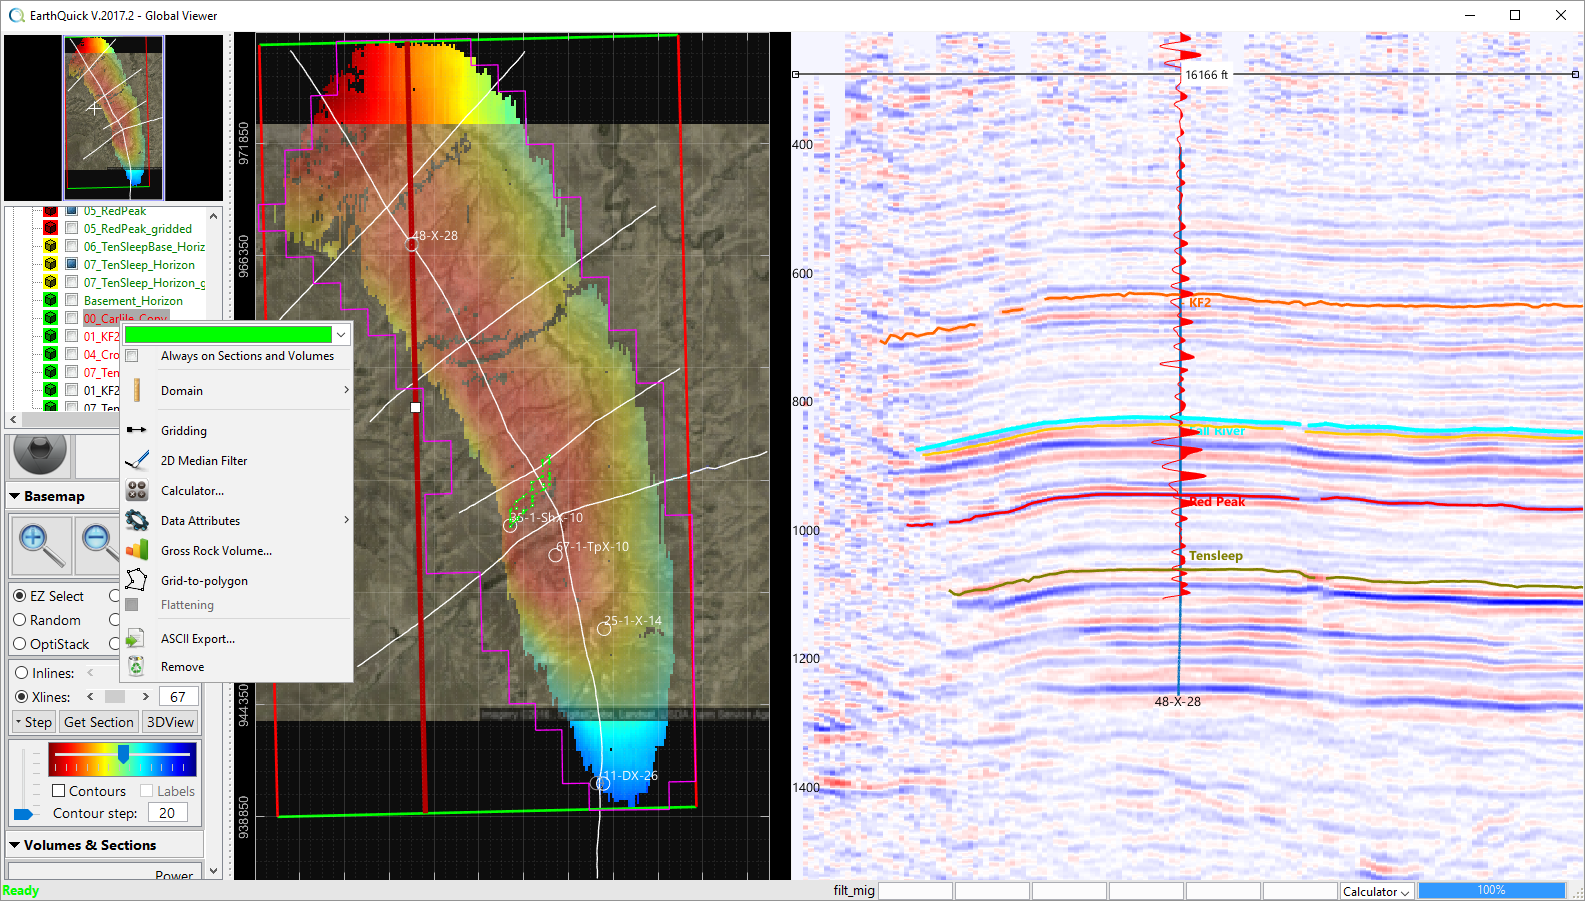
Georeferenced image overlapping interpretation grid (left). Seismic section and synthetic seismogram (right).
Data courtesy of RMOTC and the U.S. Department of Energy.
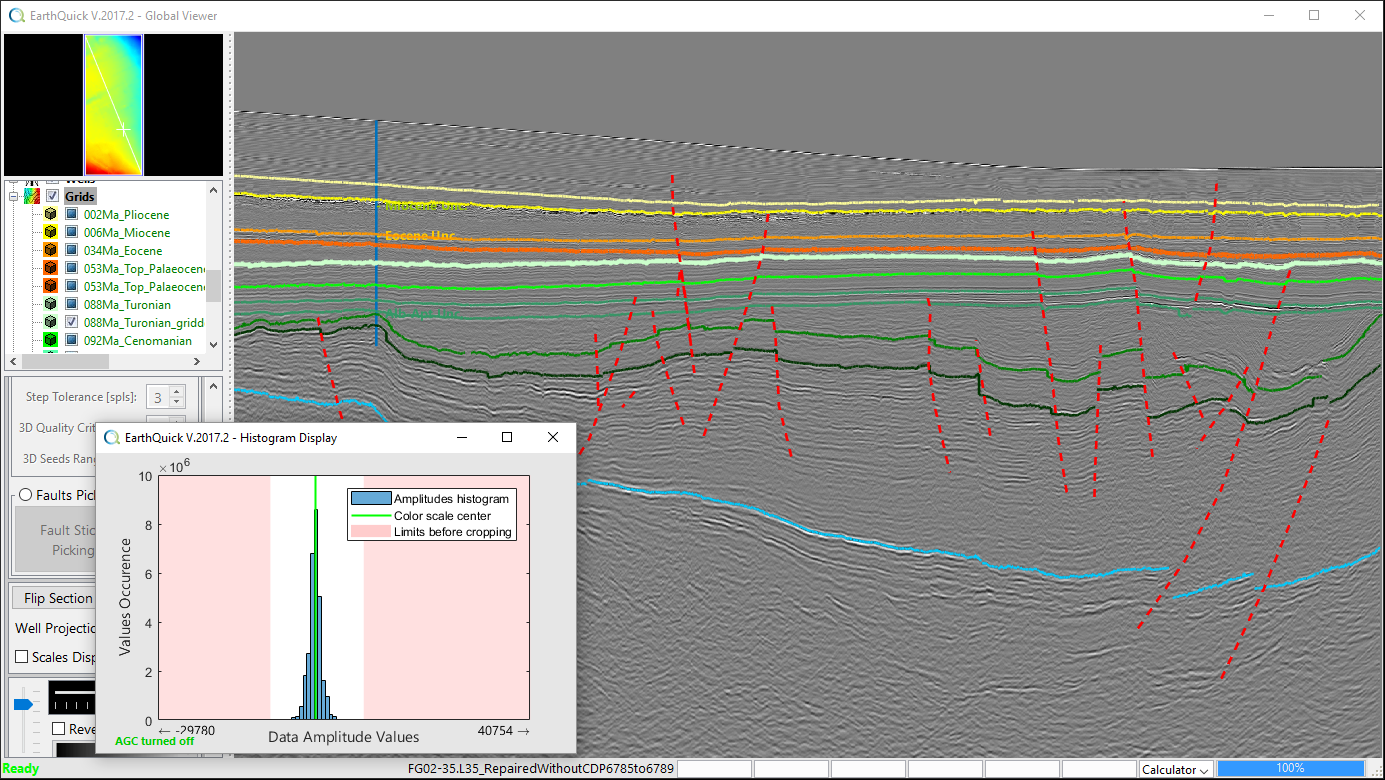
A seismic section and its reflected amplitudes histogram.
Data courtesy of RMOTC and the U.S. Department of Energy.
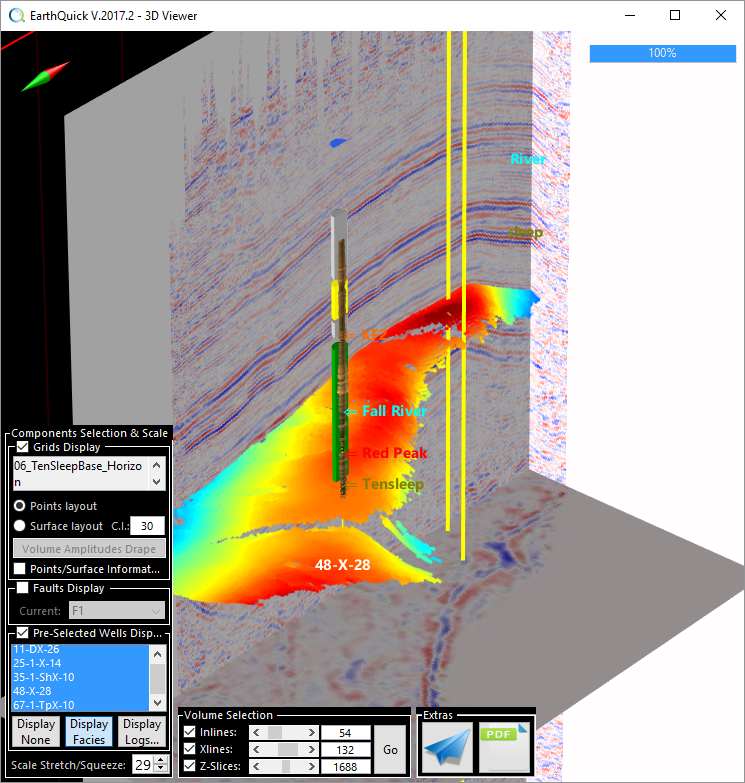
Seismic data and interpretation items with the 3D renderer and export in 3DPDF (to be opened with Acrobat Reader™): 
Data courtesy of RMOTC and the U.S. Department of Energy.
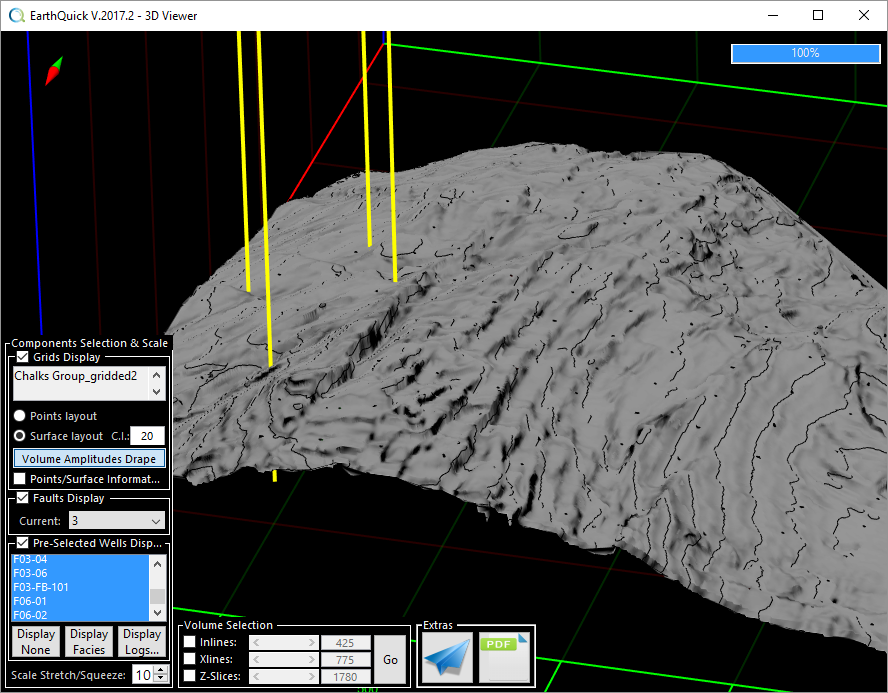
Coherency volume amplitudes draped on interpretation in the 3D viewer.
Data courtesy of Netherlands Government (Block F3).
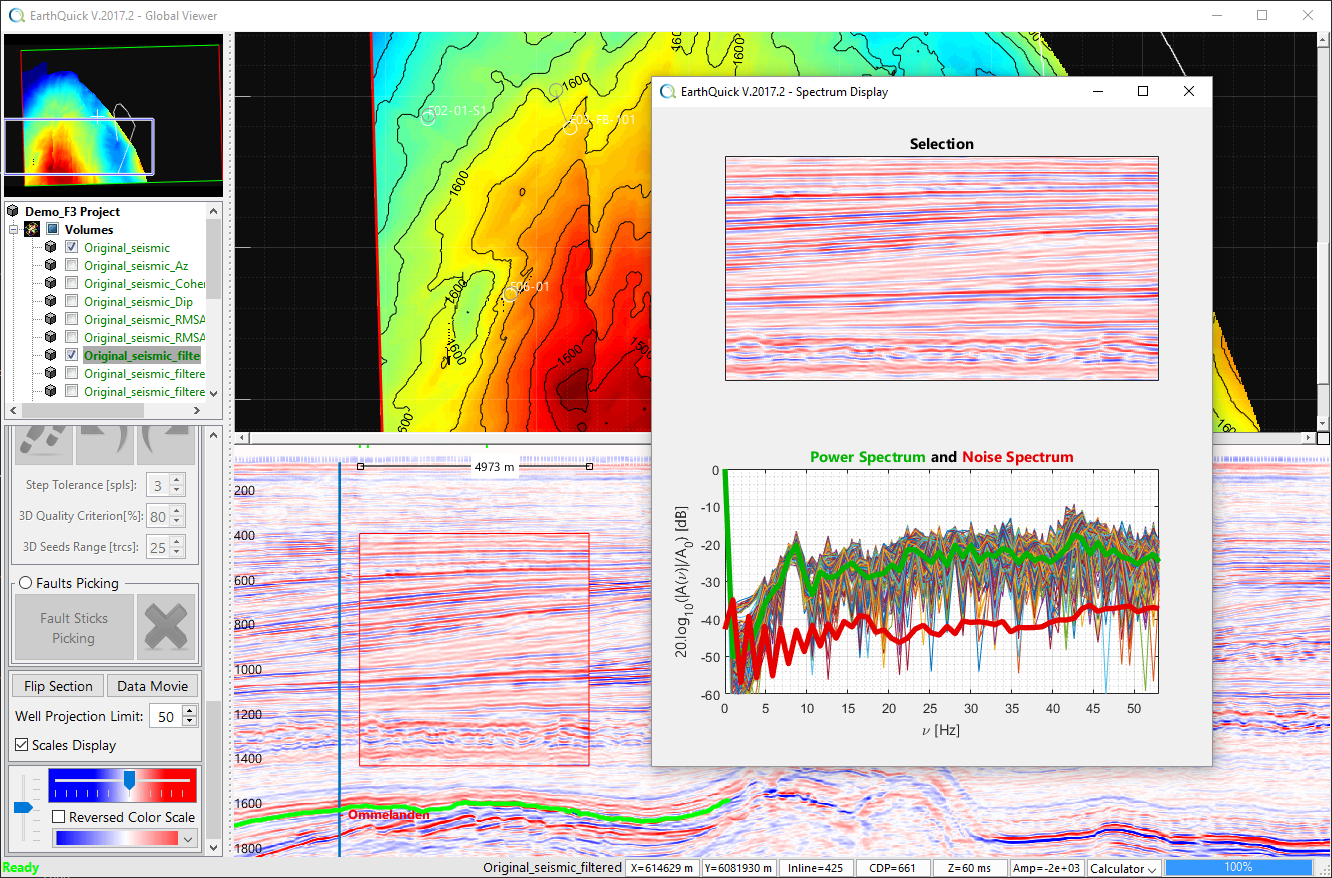
Frequency content handling and filtering in F or F-k domains on the fly.
Data courtesy of RMOTC and the U.S. Department of Energy.


